Analyze Quickstart Guide for JavaScript v2
It can be useful to monitor the trends and behaviors of your users' video playback sessions. For example, you might want to assess the popularity of a video, identify prime viewing times, etc. Metrics like these are tracked using Bitmovin's analytics functionality. This functionality is enabled when you programmatically configure Bitmovin's Player on your webpage and the metrics are viewed using Bitmovin's Analytics Dashboard.
The Playback Quickstart for JavaScript v2 showed how to embed a player into a webpage to stream an encoded video. This Quickstart shows how to modify that player's configuration to produce analytics and how to access the resulting data in the dashboard.
The following subsections describe everything necessary to analyze video playback:
- Prerequisites
- Step 1 – Locate Your Bitmovin Analytics License Key
- Step 2 – Add Analytics to the Player Configuration
- Step 3 – Add Metadata
- Step 4 – Test the Analytics
Prerequisites
The following items are required to complete this tutorial:
- DASH-encoded video files as per the Encoding Quickstart for Java tutorial.
- index.html web page from the Playback Quickstart for JavaScript that embeds the Bitmovin web player.
- Functional web server that hosts index.html. This tutorial assumes you're using the http-server npm package that was set up in the Playback Quickstart for JavaScript v2.
Step 1 – Locate Your Bitmovin Analytics License Key
In order to generate analytics data from the Bitmovin web player, you must first provide the player with your Bitmovin Analytics key. This key is available via the Bitmovin Analytics Dashboard.
Follow the steps below to locate and copy your key:
- Open the Bitmovin Dashboard in a browser and log in.
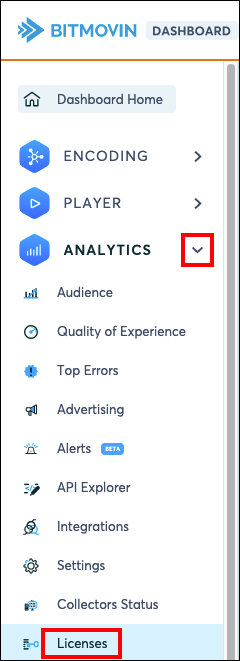
- Navigate to Analytics in the left-hand navigation bar, expand the dropdown, and select Licenses:

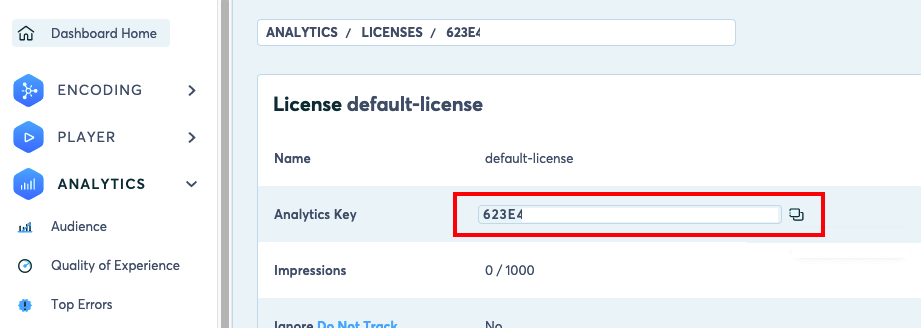
- Click on default-license in the list.
- Locate the Analytics Key and hover your mouse over it to display the copy icon:

- Click the copy icon to copy the key. This key will be used in the next section.
Step 2 – Add Analytics to the Player Configuration
Follow the steps below to add the necessary analytics fields to the player configuration:
- Open your index.html file, locate the
playerConfigobject, and add ananalyticsobject:
<body>
  <!-- STEP 2 - Provide a player container element-->
  <div id="my-player"></div>

  <script>
    //<!-- STEP 3 - Configure and Initialize the player-->
    var playerConfig = {
      "key": "946D8",
      "playback": {
        "muted": true,
        "autoplay": false
      },


      "analytics": {
        "key": "<YOUR-ANALYTICS-KEY>",
        "videoId": "my-first-encoded-video",
        "title": "A descriptive video title",
        "userId": "jsmith1",
        "cdnProvider": "CDN provider",
        "customData1": "My custom data",
        "experimentName": "My A/B Testing Experiment A"
      }

    }

    ...
- Replace
<YOUR-ANALYTICS-KEY>with the analytics key you copied in the previous section.
Tip
The
analyticsobject can optionally contain:
- up to five custom fields in named
customData1,customData2, etc. with custom values (e.g., custom metrics that you'd like to report).- a field named
experimentNamethat can be useful for tracking A/B tests.
- Populate the remaining fields of the
analyticssub object with meaningful values for your video solution. These will appear in the Analytics Dashboard later on. See Analytics Configuration Overview for the full list of metadata fields.
Step 3 – Add Metadata
You can optionally add metadata when loading a video. Bitmovin's analytics will automatically pick up the new metadata and use it.
Follow the steps below to add metadata:
- Locate the
sourceConfigobject in your index.html file. - Add an
analyticssub object and enter the metadata fields. See Analytics Configuration Overview for the full list of metadata fields:
<!DOCTYPE html>
<html lang="en">
<head>

...

</head>
<body>
  <!-- Provide a player container element-->
  <div id="my-player"></div>

  <script>

     ...

      var sourceConfig = {
        "title": "Default Demo Source Config",
        "description": "Select another example in \"Configure a Source for the player\" to test it here",
        "dash": "https://bmtestbucket2022.s3.us-west-2.amazonaws.com/myvideo/stream.mpd",
        "poster": "https://bitmovin-a.akamaihd.net/content/MI201109210084_1/poster.jpg",

        "analytics": {
          "title": "New Video Name",
          "videoId": "my-first-encoded-video"
        }
    }

    ...
Step 4 – Test the Analytics
Everything is now in place to use analytics.
Follow the steps below to test that the analytics you've configured work correctly:
- Save your index.html file.
- Ensure your web server is running.
- Open your web browser, navigate to http://localhost:8080/, and play the video.
- Navigate to Bitmovin's Analytics Dashboard in a different browser window.
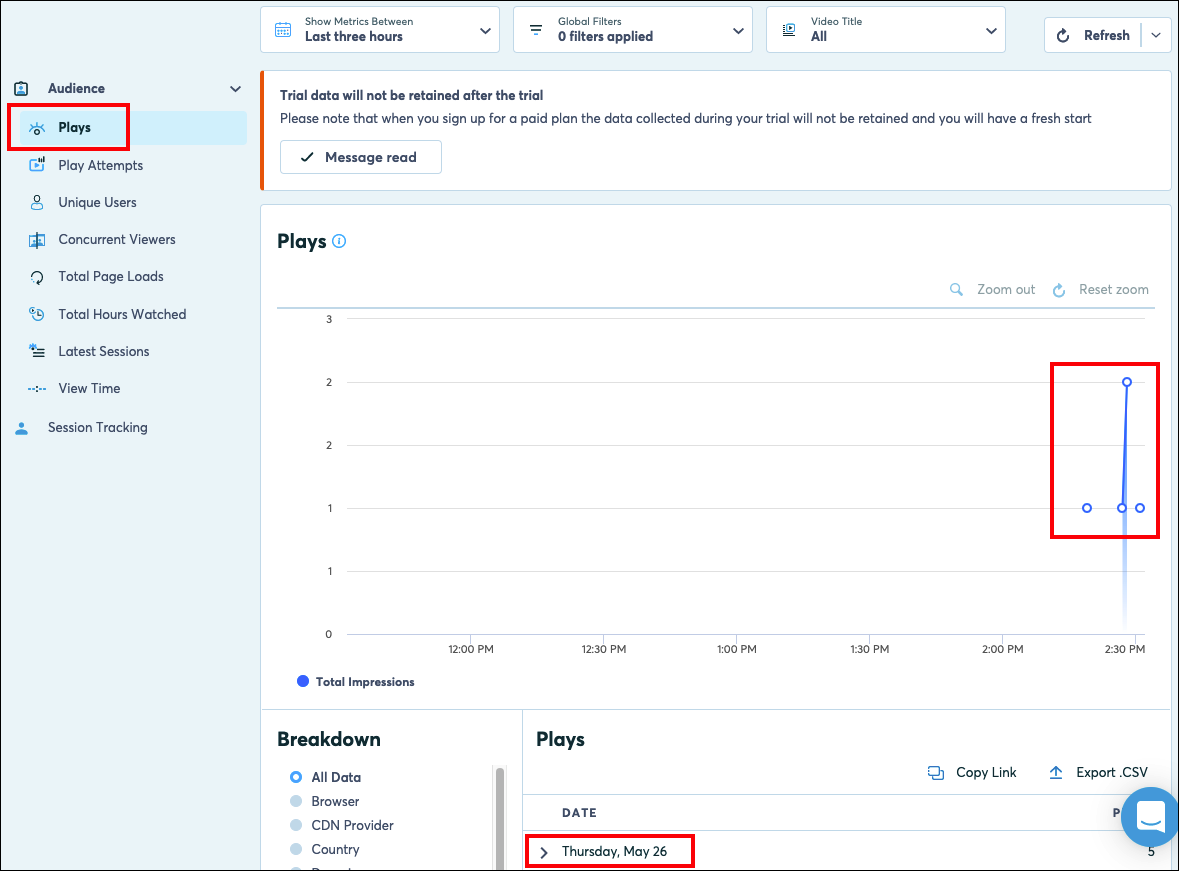
- Ensure the Analytics dropdown is expanded and select Audience.
- Ensure Plays is selected and verify that both the Plays graph and list show at least one video play. The graph in the example below shows several plays:

Note
You may need to click the refresh button on the screen before you can see data.
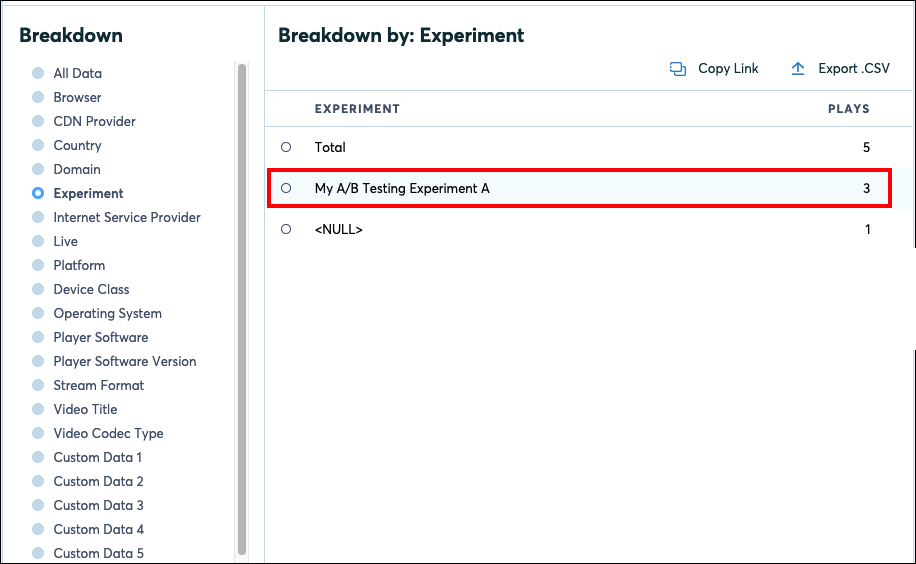
- Navigate to the Breakdown section near the bottom of the screen which shows metadata, select Experiment, and verify that the
experimentNameconfigured in Step 2 is present:

- Select Custom Data 1 further down under Breakdown and verify that the value for
customData1configured in Step 2 is present. - (Optional) Click on the other menus under Audience or under the Analytics dropdown to view other analytics metrics.
This concludes the analytics tutorial. You've now verified that Bitmovin's analytics functionality is working correctly for your video.
Updated over 3 years ago