Bitmovin Grafana Plugin
What is Grafana
Grafana is a powerful open-source platform used for monitoring, visualisation and analytics. It allows you to create customisable dashboards with charts, visualisations and alerts to further explore data from various data sources.
Installation
Install Grafana
First you need to have Grafana installed. If you don't yet have it, please visit: https://grafana.com/get and select self-managed, then follow the instructions on how to download and install.
(Please note: At this time Grafana Cloud is not supported)
Install Bitmovin Grafana Plugin
To install the 'Bitmovin Grafana plugin', so you can use the Bitmovin Analytics service as a data source in your Grafana dashboards, use the following command on your grafana server:
grafana cli --pluginUrl https://github.com/bitmovin/analytics-grafana-datasource/archive/main.zip plugins install bitmovin-analyticsgrafana cli --pluginUrl https://github.com/bitmovin/analytics-grafana-datasource/archive/deprecated-angular-based-plugin.zip plugins install bitmovin-analyticsYou will also need to allow unsigned plugins. To do this set allow_loading_unsigned_plugins = bitmovin-analytics-datasource in the grafana.ini file.
Then, simply restart your grafana deployment, using service grafana-server restart, or if you are using docker, restart the container using docker restart YOUR_GRAFANA_CONTAINER_NAME.
Configuration
Once the plugin has been installed successfully, you can add Bitmovin Analytics as a new Data Source to your deployment. Go to your Data Source Configuration overview and click Add new data source and search for Bitmovin Analytics.
In the Configuration Editor enter your Bitmovin API Key in the Api Key field (required). You can retrieve your Bitmovin API Key from within your account settings in the Bitmovin Dashboard. Optionally you can also add a Tenant Org Id. If you wish to query Ads data make sure to check the Ad Analytics Switch.
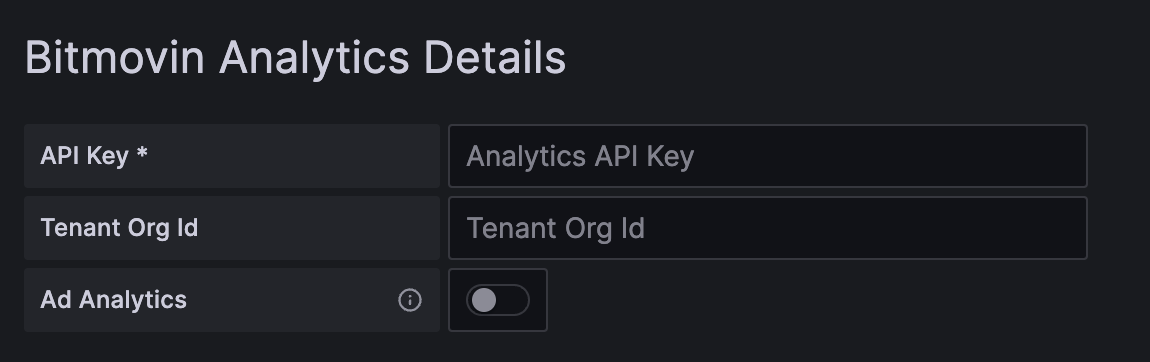
All the other fields will be filled automatically.
Usage Examples
Add a new graph to your dashboard and select Bitmovin Analytics as a Data Source. Then you will be presented with an editor to build your analytics query for your Bitmovin Analytics account. The result of that query will be used for the view. The editor works similar to our Bitmovin Analytics API Explorer which is available in our dashboard and our JavaScript API Client.
Time Series Graph
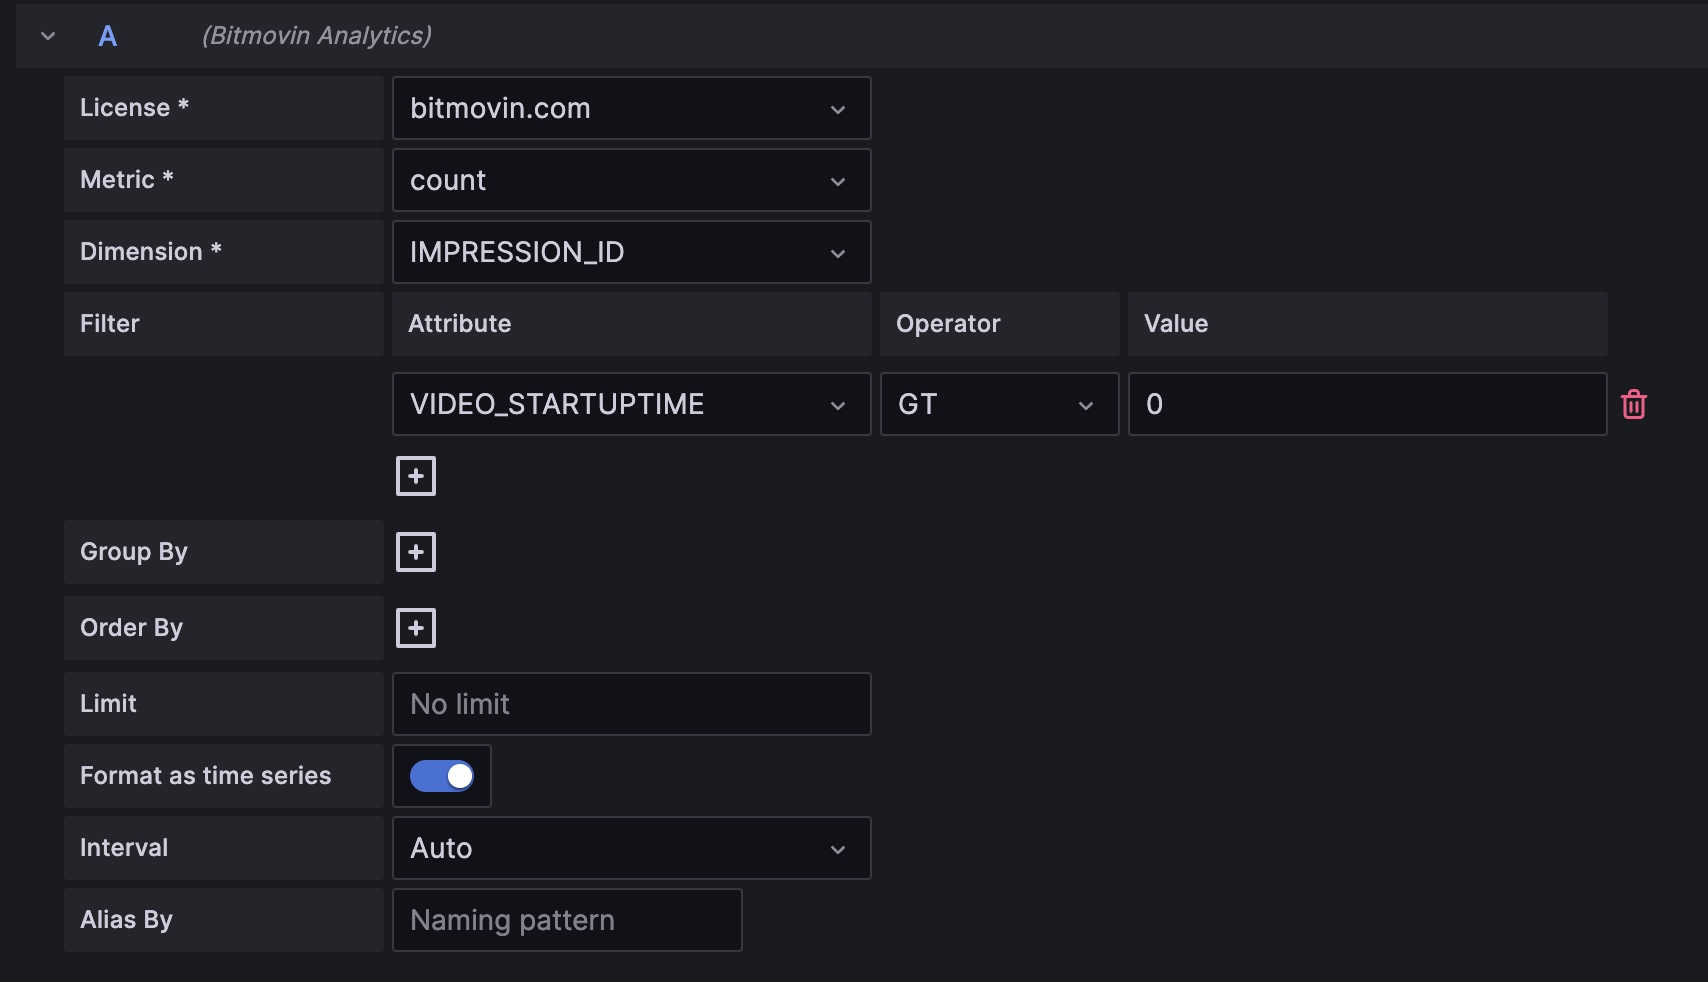
For a Time Series Graph configure the metric with following settings:
| Setting | Description |
|---|---|
| License* | Your analytics license |
| Metric* | Aggregation method to use, e.g. count, sum |
| Dimension* | Dimension to aggregate over |
| Filter | Apply filters to the query |
| Format as time series* | Check the switch to see time series data |
| Group By | Group query by dimension and plot as individual time series |
| Order By | Order query ascending or descending by dimension |
| Limit | Limit the result to given number |
| Interval* | Time granularity of queries, select AUTO to automatically adapt to selected time range |
| Alias By | Set the name of series (only visible with multiple queries in one Graph) |
Settings marked with * are required for the time series graph.
Grouped Time Series
To compare e.g. impressions per browser, we provide the Group By attribute to group the results by specific dimensions and plot them as individual time series. Multiple Group Bys are supported for time series.
Tables
Configure the metric as described in Time Series Graph but uncheck the Format as time series option and add a Group By dimension. It is recommended to add a limit (e.g. 10).
Gauges
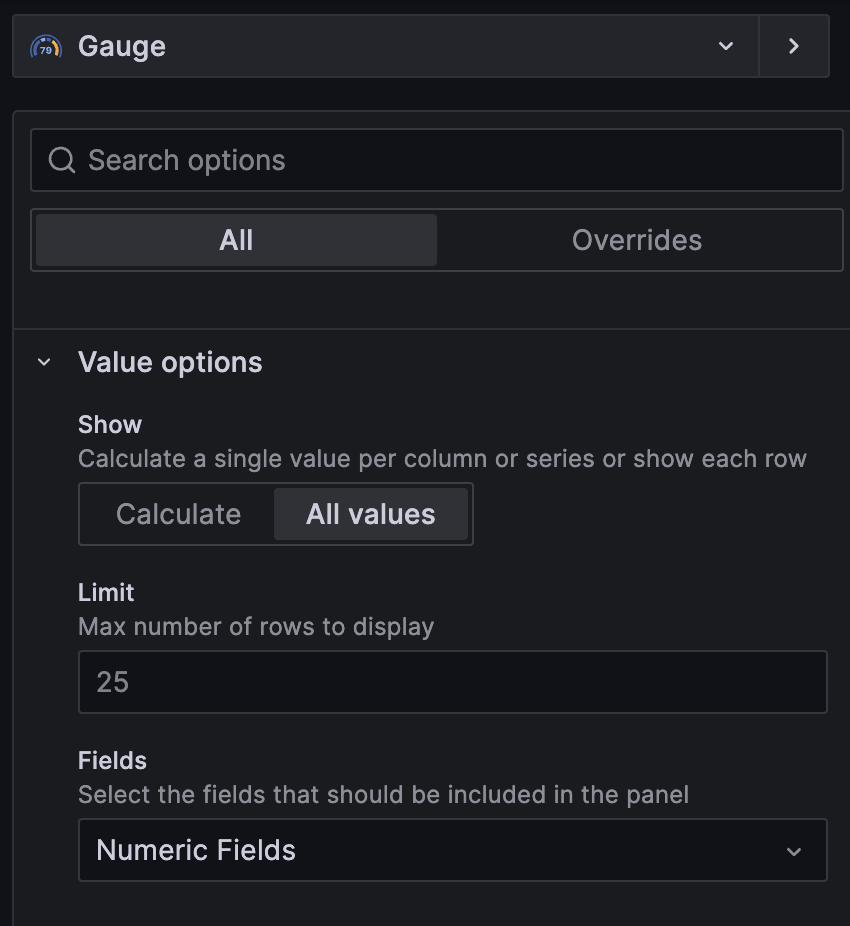
Configure the Gauge's Value Options, depending on your query.
- For table data (
Format as time seriesoption unchecked) for theShowoption selectAll Values.
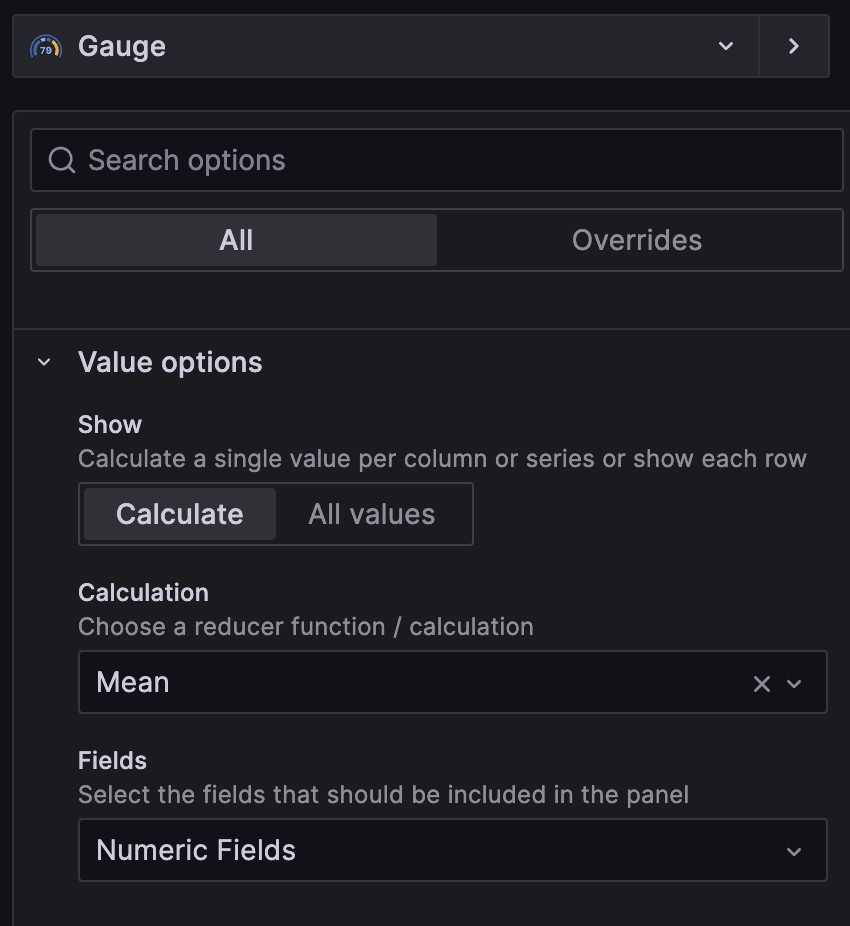
- For time series data (
Format as time seriesoption checked) for theShowoption selectCalculateand choose a reducer function.
Dashboard variables
The plugin supports Grafana's template variables, letting you build interactive dashboards.
Query variables
Add a variable of type Query, choose the Bitmovin Analytics datasource, and write one of:
| Query | What it returns |
|---|---|
licenses | All licenses on your account (label = name, value = license key) |
dimension:<DIMENSION> | Distinct values of the dimension over the last 24h, for the first license |
dimension:<DIMENSION> license:<LICENSE_KEY> | Distinct values of the dimension over the last 24h, for a specific license |
The license can itself be a variable, e.g. dimension:COUNTRY license:${license}.
Variables in filters and alias
In the panel query editor, reference any dashboard variable as $name or ${name} in:
- Filter values — e.g. set a filter
COUNTRY EQ $countryto filter by the user-selected country. - Alias by — e.g.
$browser playsto drive the series legend from a variable.
For multi-value variables, an IN filter receives all selected values; an EQ filter receives the first selected value.
Variable in license selection
In the panel query editor, the license field has a toggle that switches between picking a license from the dropdown and entering one as text (e.g. ${license}). Combine this with a licenses query variable to control the licenses of the whole dashboard from a single dropdown. The variable must resolve to a single license key — multi-value variables aren't supported here.
Ad hoc filters
Grafana's Ad hoc filters variable type is supported. Add a variable of that type, pointing at the Bitmovin Analytics datasource, and dashboard viewers get a filter bar that applies to every panel on the dashboard. Keys are Bitmovin dimensions; suggested values are fetched from the last 24h for the first license on your account.
Example Grafana Dashboard
For a demo dashboard see the example_dashboard.json in our Github repository. Configure the datasource with your Api Key and select a license key in each panel or fill in the license key in the "license": property before importing theexample_dashboard.json.
Updated about 2 months ago